Buying a grain crushing machine is one of the bigger decisions a farm can make, and it rarely comes down to the sticker price alone. The real question is how quickly the investment pays for itself through lower feed costs, better animal performance, and reduced reliance on outside contractors. Understanding grain crusher ROI before signing anything helps you go in with realistic expectations and a clear plan rather than a rough guess.
This guide walks through the key numbers to gather, how to structure a simple payback calculation, and the factors that can either speed up or slow down your return. Whether you are considering a roller mill, disc mill, or hammer mill, the framework applies across the board.
Key costs and savings that drive ROI
A solid grain crusher investment analysis starts with two columns: what you spend and what you save. Getting both sides right is what separates a reliable estimate from wishful thinking.
The cost side
The purchase price of the machine is the most visible cost, but it is rarely the only one. Installation, any required civil works, electrical connections, and initial commissioning all add to the upfront figure. Running costs matter just as much over time: electricity or tractor PTO power consumption, wear parts such as rollers and discs, routine servicing, and the operator time needed to run the machine each season.
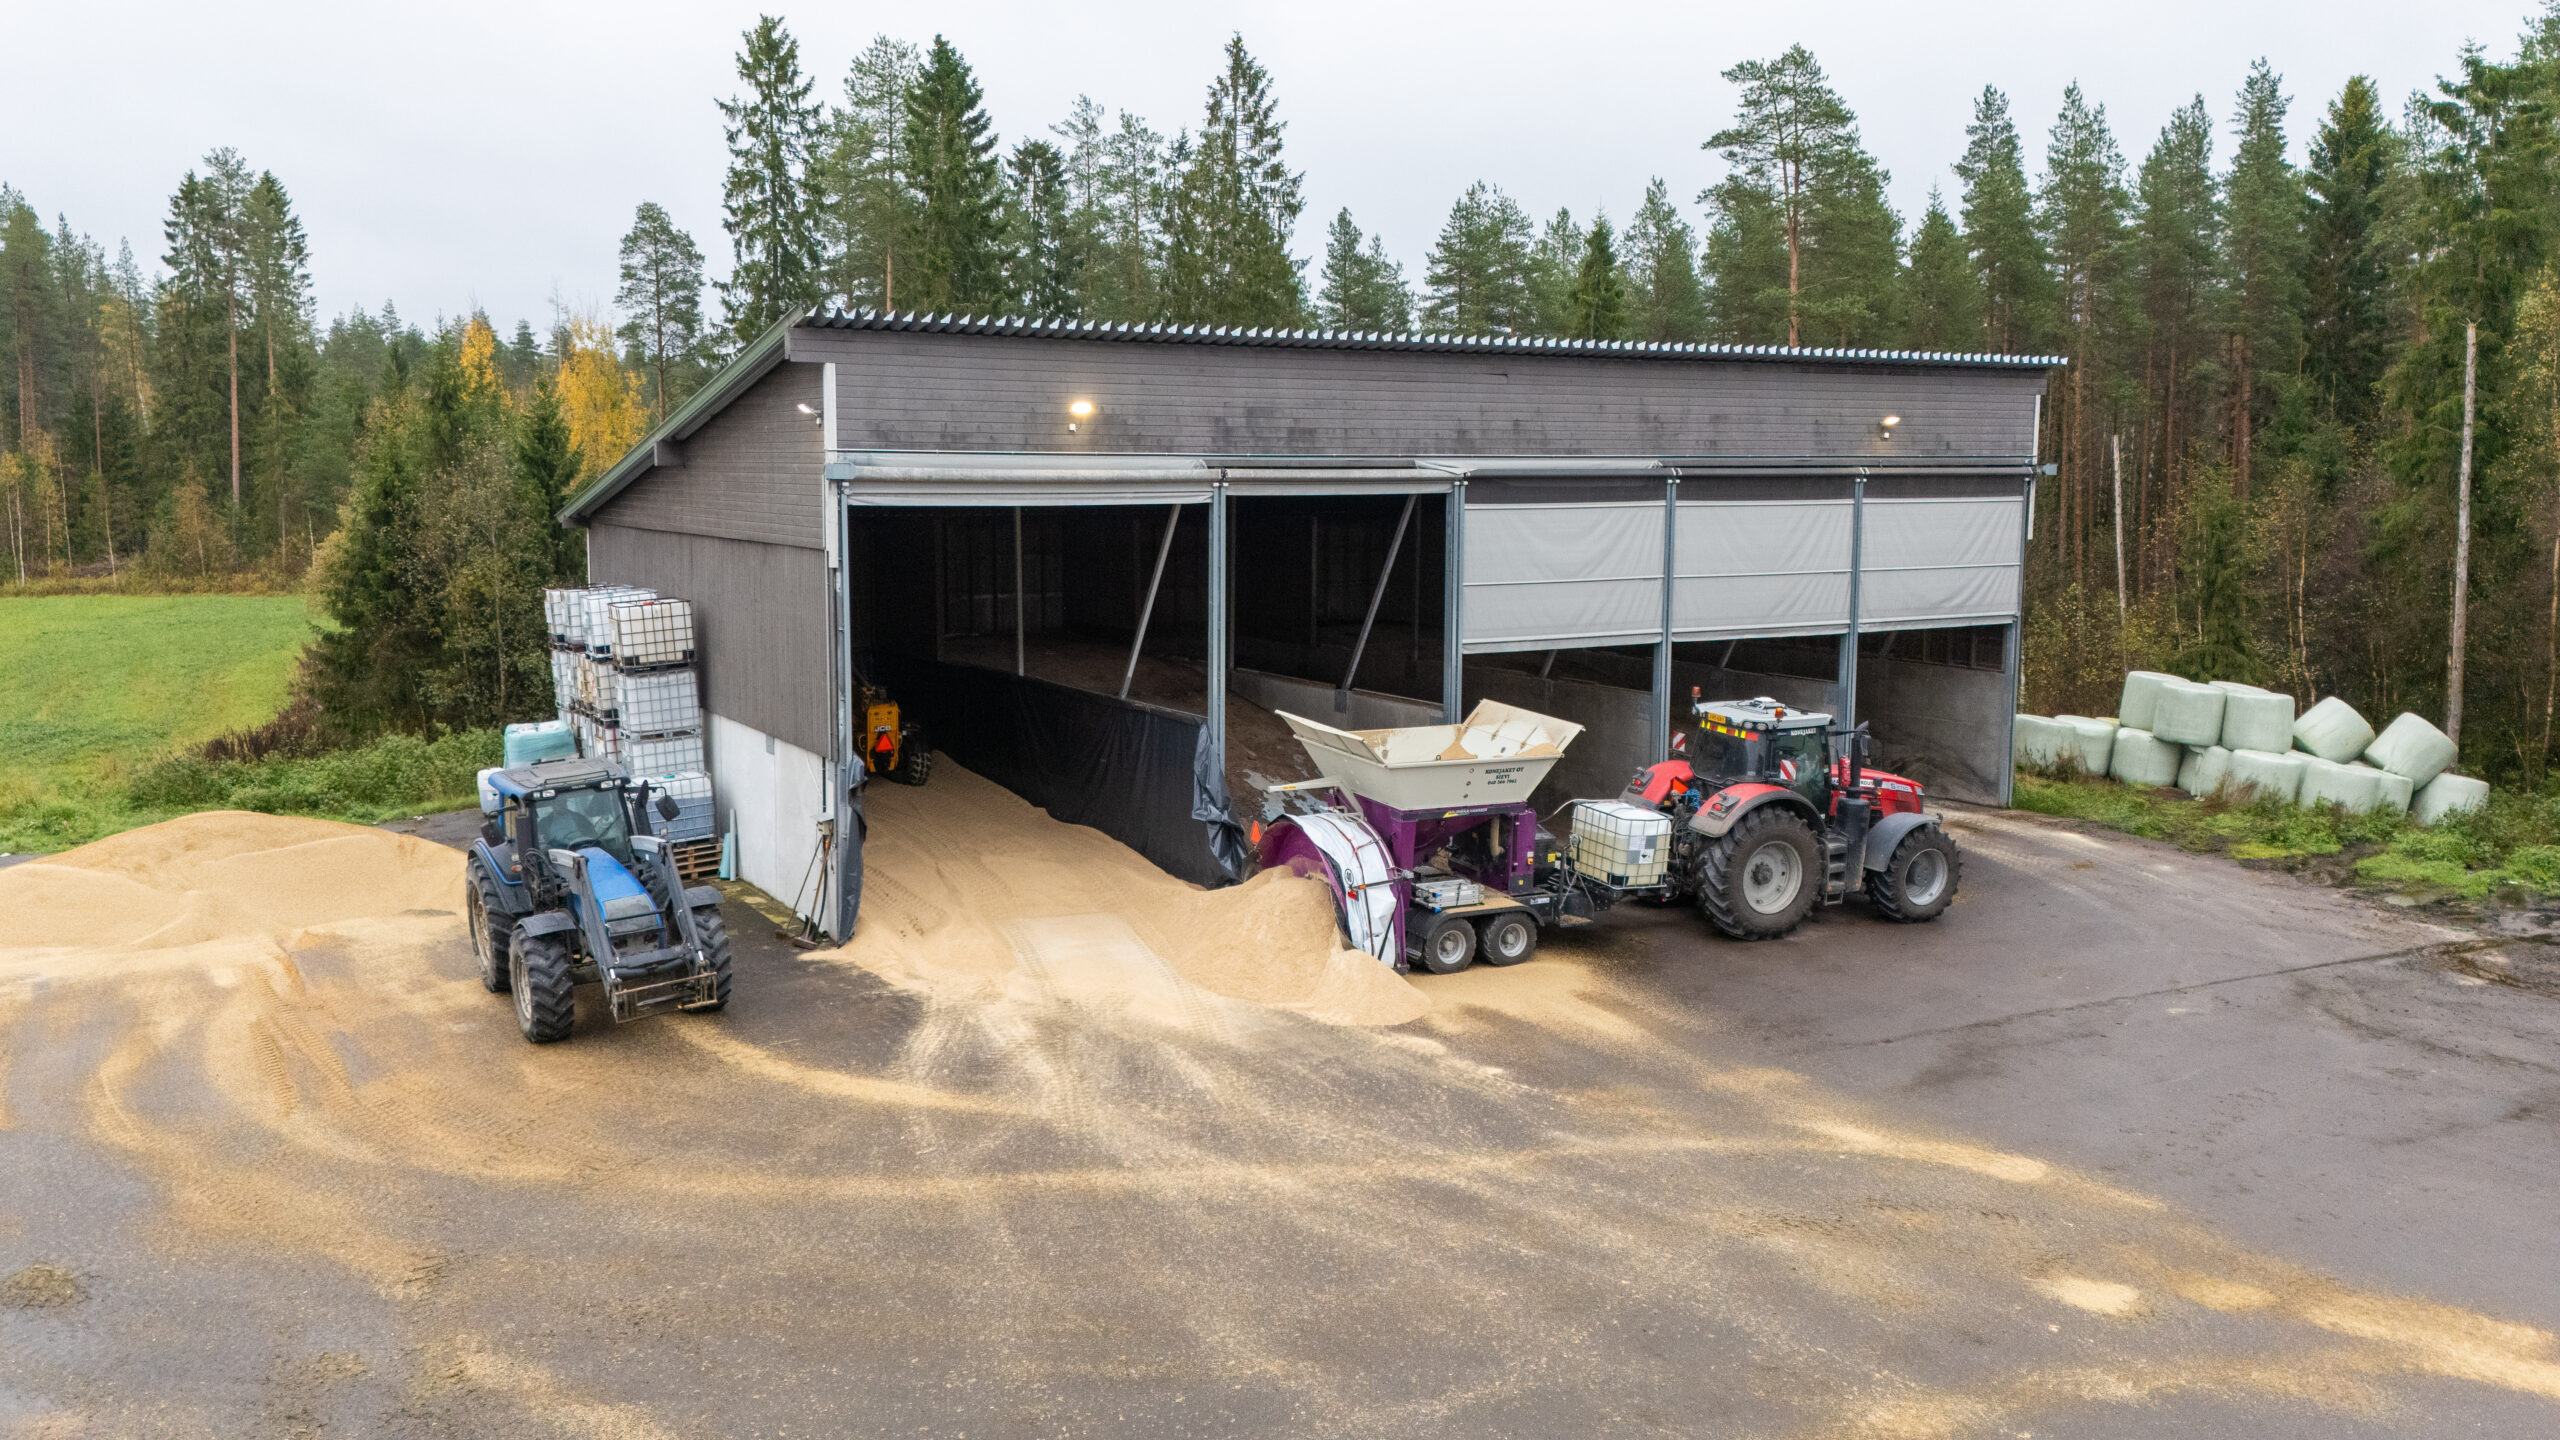
It is also worth factoring in the cost of preservatives if you are moving to crimped grain storage. Preservative use scales with throughput, so the Murska Data control system that manages automatic dosing based on grain volume helps keep that cost predictable and avoids overapplication.
The savings side
The clearest saving for most farms is the elimination of bought-in compound feed or the cost of sending grain to a commercial mill. Farms that previously dried all their grain before milling can also cut drying costs significantly, since crimped grain is processed at harvest moisture without any drying step. Energy savings here can be substantial depending on the scale of the operation.
On the livestock side, crimped grain stored airtight has better nutritional availability than dried and milled grain, which translates into measurable improvements in feed conversion and daily liveweight gain or milk yield. These performance gains have a real monetary value that belongs in the savings column, even if they are slightly harder to quantify than a reduced fuel bill.
How to calculate your payback period step by step
The payback period answers a simple question: how many years will it take for the cumulative annual savings to equal the total investment cost? The formula is straightforward, but the quality of the inputs determines how useful the result is.
Step 1: Establish total investment cost
Add together the machine purchase price, delivery, installation, and any ancillary equipment such as augers or conveyors. This is your baseline figure. If you are financing the purchase, include the interest cost over the loan period to get a true picture of what the investment costs you.
Step 2: Calculate annual net savings
Work out what you currently spend on the activities the machine will replace: bought-in feed, contract milling, grain drying, or a combination. Then subtract the estimated annual running costs of the machine itself, including power, wear parts, and maintenance. The difference is your net annual saving.
For example, if replacing contract milling and feed purchases saves a farm the equivalent of a meaningful five-figure sum annually, and the machine costs roughly a third of that to run, the net saving becomes the denominator in the payback calculation.
Step 3: Divide and sense-check
Divide total investment cost by annual net savings. The result is the payback period in years. A feed processing investment that returns to zero in three to five years is generally considered strong for farm machinery. If the number comes out above seven or eight years, it is worth revisiting the assumptions or looking at whether a different machine size would be a better fit for the operation’s throughput.
Factors that shorten or extend the payback timeline
The payback calculation gives you a baseline, but real-world results shift depending on how the machine is used and what the farm’s specific situation looks like.
Throughput is probably the biggest variable. A machine running close to its rated capacity for more weeks of the year will generate savings faster than one that sits idle for long stretches. Our roller mills and disc mills are designed with this in mind: the W-Max disc mill range, for instance, handles everything from barley and oats to maize and beans, both dry and at harvest moisture, which means it stays productive across a wider range of conditions. The largest W-Max 40 model processes up to 100 tonnes of maize per hour, making it well suited to operations where throughput volume is the primary driver of ROI.
Grain and feed prices also move the timeline. When compound feed prices are high, the saving from processing your own grain grows proportionally and the payback shortens. Conversely, a period of low feed prices extends it. Building your calculation around a conservative average rather than a peak price gives a more resilient estimate.
Maintenance discipline plays a quiet but significant role. Machines that are serviced on schedule and fitted with genuine wear parts retain their efficiency and avoid costly unplanned downtime. Our roller mills have built a reputation for durability across varied climates precisely because the design prioritises easy access to service points, which makes it more likely that maintenance actually gets done.
Hidden value beyond the payback calculation
Payback period captures the financial return, but it does not capture everything that makes a grain crusher cost worthwhile over the long term.
Control over feed quality is one of the most consistently cited benefits among farmers who have made the switch. Processing your own grain means you know exactly what goes into the ration, when it was processed, and at what moisture level it was stored. For pig and dairy farms in particular, where ration consistency directly affects performance, this control has value that does not show up in a cost-per-tonne comparison.
Crimped grain storage also reduces the risk of mycotoxin development compared to grain that is dried and stored conventionally, because the airtight, acidic environment created by the preservative inhibits mould growth. Avoiding a mycotoxin problem, even once over the machine’s lifetime, can easily justify a significant portion of the original investment.
There is also the question of operational resilience. Owning your own processing capacity removes dependence on contractors whose availability may not align with your harvest window, and insulates the farm from fluctuations in contract milling rates. That independence has a strategic value that is difficult to put a number on but is very real when harvest pressure is at its peak.
Common mistakes when estimating grain crusher ROI
Even well-intentioned calculations go wrong in predictable ways. Knowing where the common errors sit helps you build a more honest estimate from the start.
Overestimating utilisation rates is the most frequent mistake. It is tempting to run the numbers assuming the machine operates at full capacity for the entire season, but in practice, weather delays, staff availability, and competing farm tasks all reduce actual throughput. Using 70 to 80 percent of theoretical capacity as your working assumption gives a more realistic picture.
Ignoring wear and maintenance costs is another common gap. Rollers, discs, and hammer mill screens all have finite service lives and need to be replaced periodically. Leaving these out of the annual running cost makes the net saving look better than it is. Asking the supplier for realistic wear part lifespans and costs at the time of purchase closes this gap before it becomes a surprise.
Forgetting the value of your own time cuts both ways. Some farms undercount the labour they currently spend managing external milling or feed deliveries, which understates the saving. Others forget that running an on-farm machine also takes time, and do not account for that in the running cost. A balanced treatment of labour on both sides keeps the estimate honest.
Finally, using peak-year savings as the baseline sets expectations that normal years cannot meet. Grain prices, feed prices, and animal numbers all fluctuate. A payback calculation built on a representative average year will hold up better over time than one built on the best year in recent memory.
If you are ready to move from estimates to actual figures for your farm, get in touch with us and we can help you work through the numbers with the right machine for your operation in mind.